

Since Maria, the question I’ve gotten more than any other is: “So if X number of Puerto Ricans move to Florida because of the hurricane, what does this mean?”
Honestly, I write this blog with some hesitation.
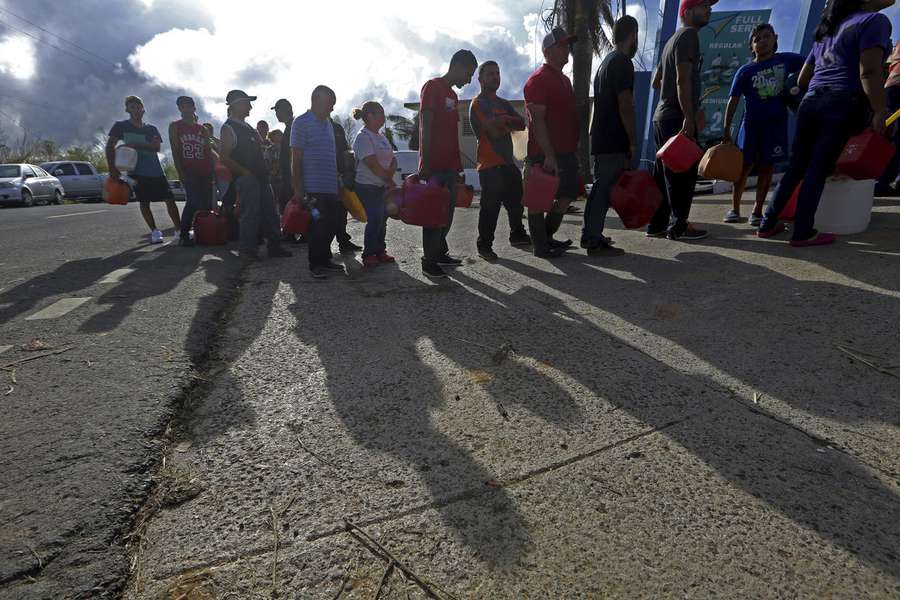
As I work on this piece, 80-90 percent of the population still lacks power and some 50 percent lack potable water, so politics is really the last thing anyone should be worried about. But given the likely ongoing interest in this question, and in part, because I use this medium to share my own research, I wanted to offer some thoughts.
Both POLITICO’s Marc Caputo (here) and The Washington Post’s James Hohmann (here) have written interesting pieces on the subject, but I wanted to try to give it more data context. So, in this blog, I’ll try to provide my thoughts based on analyzing census data, voter registration data, and presidential election trends.
For my Democratic friends, a word of warning about the latter — particularly regarding 2018, recent turnout in off-year cycles in Orange and Osceola County has been quite low. Comparing the 2012 and 2014 elections, Osceola saw turnout drop from 67 percent to 41.3 percent, the third largest drop-off in Florida, and Orange fell from 68.1 percent to 43.3 percent, the sixth highest drop-off. So, if you want to take advantage of anything I will write about from this point onward, don’t stop organizing.

One other word of warning, this blog only looks at the impacts in three counties: Orange, Osceola and Seminole, because the acute impact of Puerto Rican growth is likely to be most significantly felt here. However, as we saw in 2016, the political impacts of Puerto Ricans in these three counties were outweighed by the Trump surge among whites in the outlying Orlando media-market counties. Alex Leary at the Tampa Bay Times just wrote an excellent piece on this dynamic.
One last note: I wrote a piece called “Orlando Rising” about the demographic changes that were occurring in the region then if you are curious for comparison purposes.
So, here goes …
Like so many things, the answer to the Maria question lies in history.
For the sake of this exercise, let’s start the clock in 2000. The 2000 election was by far the closest in our state’s history, and thus provides a good, balanced starting point when looking at elections. We also have census data from 2000 to provide another benchmark.

In terms of voter registration, we can’t really analyze data before 2006, since most counties in Florida grouped “Hispanics” into their race: either Black or White. One quick note, as I do in all my pieces, I will use Black, not African-American, because Florida also has a large Caribbean-American population that gets categorized into the same data.
So, let’s start with census data.
Keep one thing in mind, the 2015 data are based on census projections based on their year-round survey work. While they are still fairly accurate, we won’t see exact numbers until sometime in 2021 when the 2020 census data are released.
So, with that caveat …
In 2000, the Orlando urban counties had 1,434,033 total residents. Of this population, 18.1 percent was Hispanic, and another 14.7 percent was Black. The area’s non-Hispanic White population was just over 62 percent.
So, let’s move ahead to 2015.
Population in the tri-county area had grown to 1,967.255, with Hispanics now making up 29.6 percent of the population, with Black residents also increasing, to 16.3 percent. Non-Hispanic Whites had dropped to 47 percent of the area’s population.
In fairness, the 2000 census had fewer categories of people, so that 62 percent number is probably high, but regardless, that is a significant change.
Looking at it another way, between 2000 and 2015, the area grew by 532,222 residents, of which roughly 325,000 are Hispanic, with the total Hispanic population growing from just under 260,000 to almost 585,000.
Often overlooked in the region, the area’s Black population also grew substantially, from 210,000 to 320,000. At the same time, the area’s non-Hispanic White population grew by just 32,000 — which is actually less than the Asian population, which grew by 45,000 over the same period. Again, it is important to note the non-Hispanic White count was likely artificially high in 2000.
But any way you look at it, the Hispanic population exploded, and the entire area got much more diverse.
So, what does that mean for the politics?
Let’s start with voter registration. I want to start with a caveat from census data: Hispanic is a self-reported data point on voter registration cards, and it typically underrepresents the real number, as some Hispanics will only self-report as White or Black. The census data above collects all Hispanics, regardless of their race. This is one reason why if you look at public polling or exit polling, the Hispanic share is often higher than the state’s voter registration numbers, especially in presidential years.
So, going back to 2006, at the time the book closed on the 2006 General Election, there were just over 941,000 registered voters in the area, of which 17.5 percent, or 165,000 were Hispanic. Another 12.3 percent were Black, with non-Hispanic Whites making up 62 percent, roughly the same as the census proportions.
Two other data points: In 2006, Hispanics broke 43 percent Dem — 21 percent R, and 36 percent NPA, while non-Hispanic Whites broke 48 percent Rep, 30 percent Dem and 22 percent NPA — which may seem high, but isn’t for this part of the state, given the region’s GOP tradition.
Fast forward to the 2016 book closing. There are now 1,264,778 voters in the area, and Hispanics have grown from 165,008 to 312,323 voters, which equates to 24.7 percent of the electorate. Black voters are up to 14.2 percent, and non-Hispanic white is down to 51.2 percent, a number that I believe, even before any possible Hurricane Maria impact, will be below 50 percent in 2020.
Those other comparative data points from 2006: Hispanics are now 54 percent Dem, 14 percent Rep and 32 percent NPA. In fact, among Whites and Blacks, both political parties lost share of registrants to NPA (non-Hispanic White is now 46R-27D-27NPA). In fact, the only place where partisans increased their share of the electorate was Democrats with Hispanics.
Look at it another way, and the dynamic is even more remarkable. Since 2006, the area’s voter registration grew by about 323,000 voters. Of that, 45 percent was Hispanic, while 21 percent was non-Hispanic White, and about 19 percent of the growth was among Black voters. The raw numbers are even starker: Hispanic Democrats in the decade leading up to 2016 grew by 99,000 voters, while Republicans growth was just under 9,000.
So how did that play out in elections?
In 2000, in the Orlando metro area (again, Orange, Osceola and Seminole counties): George W. Bush beat Al Gore by just under 9,000 votes — a margin he actually grew to 33,000 votes in 2004. When you think about the urban Central Florida core today, it is hard to think that just 12 years ago, Republican presidential candidates actually won the region. Again, this was a pretty Republican area prior to the recent demographic shifts.
But not anymore. In 2016, Hillary Clinton won those same three counties by over 165,000 votes. In fact, in just Orange County (Orlando proper), where John Kerry beat George Bush by 1,000 votes in 2004, Hillary Clinton beat Donald Trump by 134.000 votes just 12 years later.
Another way of looking at it, the two-party candidate margin shifted almost nearly 175,000 from Bush 2000 (almost 200K from 2004). And this wasn’t just the “Obama coalition” or “Obama turnout” — Clinton’s 2016 margin was about 65,000 votes larger than either Obama election. In a word, this is demographics.
Another metric: In 2000, Democrats had no locally elected Members of Congress. A Democratic seat from Jacksonville meandered down to Orlando, but that was it. In 2016, the region has three local Democratic Members of Congress, which reflect the growing diversity of the area: a Puerto-Rican, an African-American and a Vietnamese American.
So let’s talk Hurricane Maria.
First, it is important to keep in mind just how much has changed in the last 15 years in these three counties for Puerto Ricans. In 2000, the community was emerging, as was the community’s social and political infrastructure. I used to say to reporters in those days who were writing about the early Puerto Rican political dynamic, one of the big differences between Miami and Orlando is you could figure out who the opinion leaders were in Miami, but it wasn’t as easy in those days in Orlando.
Today is quite different. Puerto Ricans who come to Orlando now will find a ready-made community, with a social structure solidly in place, a growing job market, and in many cases, friends and family already here. In other words, while moving is never easy, migrating to Orlando following Maria will be a far easier adjustment than it was 15 or 20 years ago.
And far more than a Hispanic immigrant, the Puerto Rican impact on the politics is acute. As long as a Puerto Rican migrates and takes up residence in Florida more than 30 days before a given election, they can vote. As we’ve seen since 2000, the immediate impact in these three counties has been to the significant benefit of Democrats.
So, what does it all potentially mean?
There is no way to know how many people could migrate to Central Florida. Pretty much every estimate out there is a dart thrown against a wall.
But we do know this. Over the last 10 years, 67 percent of the Hispanic voter registration growth accrued to the Democrats, while only 6 percent went to the GOP, so any growth from Maria, which is over and above the growth which is already happening in Orlando, will only exacerbate the local political trends.
Let me close with one note of caution: Florida is a big complicated state, and there is not, nor will there ever be, a single silver bullet that “turns” Florida one way or another. Florida is five or six really big states in one. The North Florida media markets alone are the voting power of Iowa, and just Miami-Dade County has roughly the same voting power as Nevada.
Despite Florida’s razor close margins — with only 18,000 votes separating Republicans and Democrats out of the 50,000,000 ballots cast for President since 1992, and with the last two presidentials and two governor’s races each being decided by a point, Florida is historically close because of the sum of these diverse parts, not because of any one thing in any one spot. You win Florida by managing the margins. So, while these trends help the Democratic balance sheet, a win in 2018 and 2020 also means reducing the Trump and Scott margins in other counties.
To the latter point, Florida also has this interesting ability to find equilibrium — when it looked like the high migration to Florida from around the mainland would shift Florida forever into the GOP column in the early 2000s, large Hispanic and Caribbean growth balanced it out. Of late, the demographic gains that Democrats have made have been balanced out with increasing support among Whites for Republican candidates. And I expect this balance to continue going forward, at least through the next few presidential cycles. With that being said, I do think over time, Republicans will reach a ceiling with Whites (and Trump could well be the ceiling), meaning if the GOP can’t find a way to improve its vote share with Hispanic voters, their math will get harder and harder. But Democrats, remember, none of that is a sure thing.
So while a significant migration from Maria will absolutely impact Central Florida politics, and those impacts will help Democrats statewide — it won’t “tip” the state any more than any other population shift that could occur, because well, Florida is gonna Florida.
In a world where the Jaguars crush the Steelers, and lead their division after 5 games, literally anything can happen!
May God Bless our fellow Americans in Puerto Rico.